
In the world of fixed odds wagering (see: not parimutuel wagering like horses or marketplaces like BetFair/NoVig/ProphetX), one of the more common questions I’ve seen is “how do books determine their opening lines and odds?” While most sportsbooks employ teams of traders and quantitative analysts, the actual way that lines are discovered is determined by the type of sportsbook you’re concerned with. For background, some books are typically classified as sharps– this depends on sport, but many include the offshore likes of Pinnacle/BetCris/Bookmaker and Circa stateside (these books may be referred to as “market makers” going forward). Given that these are the “experts” we’ll start with how they open and adjust their lines, then cover the other books– looking at line and pre-match odd movement for a book within each group.
How “Sharp” Books Set Lines (Price & Line Discovery)
Books may have an initial model to predict scores for use in things like spreads and totals. These likely employ basic statistical methods like linear regression, weighted/exponential moving averages or even using more advanced ML algorithms like XGBoost or even deep learning. These latter, more complex strategies, typically aren’t going to be that useful, because all that market making books don’t care about being 100% accurate when hanging their opening line– because they use small limits and adjust as action comes in.
Example
Let’s imagine a game with the following opening line:
Houston Astros +102 (49.5%)
Miami Marlins -113 (53.1%)
Stake limit: $250
Notice that the book starts with a relative small wager limit. When this line gets posted, multiple bettors, who are known to be profitable players by the book, bet $500 on the Marlins. This means that the book weren’t likely favoring Miami as much as they should have been, so they adjust the line to:
Houston Astros +118 (45.9%)
Miami Marlins -130 (56.5%)
Stake limit: $500
This time, 2 hours go by and the Marlins get some action, but not as much as before, so they adjust the lines to
Houston Astros +120 (45.5%)
Miami Marlins -132 (56.9%)
Stake limit: $2,000
After this change, both sides are getting around the same action, so after another few hours, they up the stake limit to $5,000. If the wagering remains relatively balanced, it will go up even further based on the prominence of the game. Limits vary by book, league, wager type and even consider bettor history in some scenarios.
What happens is a market making book posts a line, but with smaller limits, and as more and more bets come in, the lines adjust, the book’s confidence increases and they in turn begin to take larger wagers. If an influx of large wagers come in favoring one side, they can adjust the line and/or odds as well as their limits.
Price/Odds Discovery Evolution (Pinnacle)
| League | Offer Type | n= (sample) | Odds Delta % | Lines Delta % |
| MLB | Runline | 762 | 3.26 | 0 |
| MLB | Total | 1373 | 3.68 | 1.18 |
| MLB | Moneyline | 808 | 4.56 | – |
| NBA | Spread | 1146 | 1.77 | 1.19 |
| NBA | Total | 1919 | 2.02 | 5.49 |
| NBA | Moneyline | 757 | 4.62 | – |
For this article, I went into the SQL mines and pulled opening vs closing pre-match lines (well, <10 minute sample interval vs line posting) for Pinnacle, for two leagues that they are typically a sharp/market making book for, around the past 8 months. This looks at how much their odds and lines change from when they are first posted until the last sampling before the event’s official start time. As you can see, over a large enough sample, Pinnacle typically estimates their moneyline odds within 5% (4.56% for MLB and 4.62% for NBA)– which is

They are typically even closer when it comes to spreads and totals, but keep in mind, they can adjust both lines and odds for those scenarios. Over time, the stake limits also increase– starting as low as $250 and growing up to $25k for some of these NBA main lines.
The process for props and player oriented wagers typically follows a similar process, but with both lower initial and final limits. There is less overall wagering volume (see: less sharps, smaller sample size) as well as higher volatility (game to game differences), meaning it is much harder to predict a single event outcome. Hammering props when you can find an edge is a sure fire way to get limited on the other books.
The Other Books’ Process
Most of the sportsbooks that you see incessant commercials for on TV, Youtube and social media are what we’ll call The Other Books. I use this term with a 100% derogatory connotation, which I’ll delve into in other posts, but for now, we will go into how they set their lines and odds. Reading Reddit threads leads you to believe that they simply copy their odds from the sharp books, but that doesn’t really seem to be the case.
I pulled the below data, based on the first found timestamp for market observations. Polymarket posts some events days in advance, but Fanduel is typically one of the first to post odds for events, on average. I didn’t really believe this at first, so I dug in and made sure I didn’t have a sampling error or preference in scraping order, but it looks good. A similar theme emerges with NBA, where DraftKings tends to be the earliest non-exchange book to post their lines. There could be other things at play here, such as public delayed feeds or odds being spammed in a <10 minute window, but those are relatively small possibilities for this particular scenario.
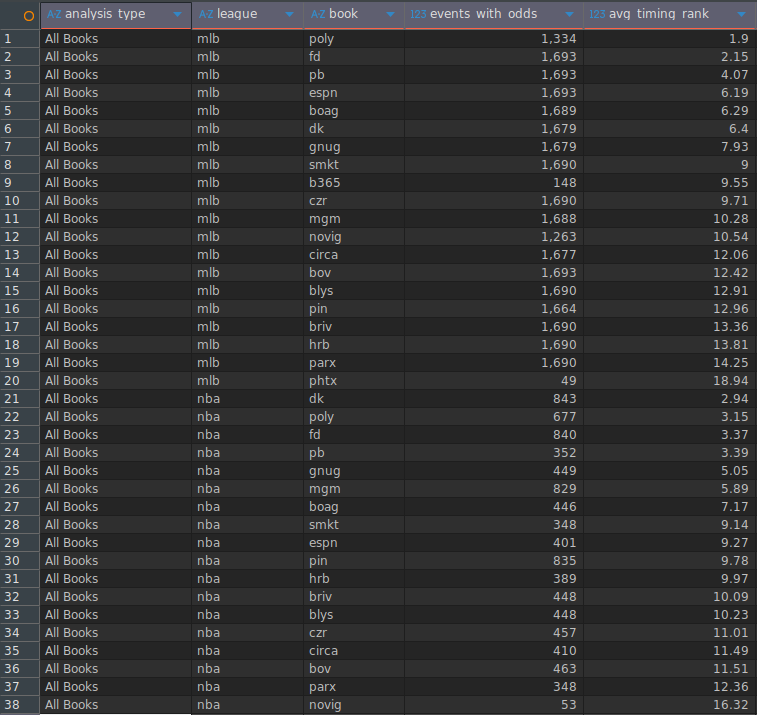
After seeing the orders that books post their lines, you can start to build assumptions of who is modeling lines vs who is probably just copying other books’ movements. Notice, though, the sharps as commonly assumed (e.g. Pinnacle, Circa) have average ranks of ~10-13, meaning they may be coasting and actually chimping other lines before posting their own. With that said, let’s now look at the fastest (at least per that query) of the other books and see how much volatility there are in their pre-match lines.
Price/Line Discovery Evolution (Fanduel)
| League | Offer Type | n | Odds Delta % | Line Delta % |
| MLB | Runline | 496 | 28.46 | 3.37 |
| MLB | Total | 274 | 9.19 | 2.66 |
| MLB | Moneyline | 1245 | 34.85 | – |
| NBA | Spread | 1406 | 8.14 | 10.18 |
| NBA | Total | 1391 | 4.74 | 12.67 |
| NBA | Moneyline | 848 | 23.61 | – |
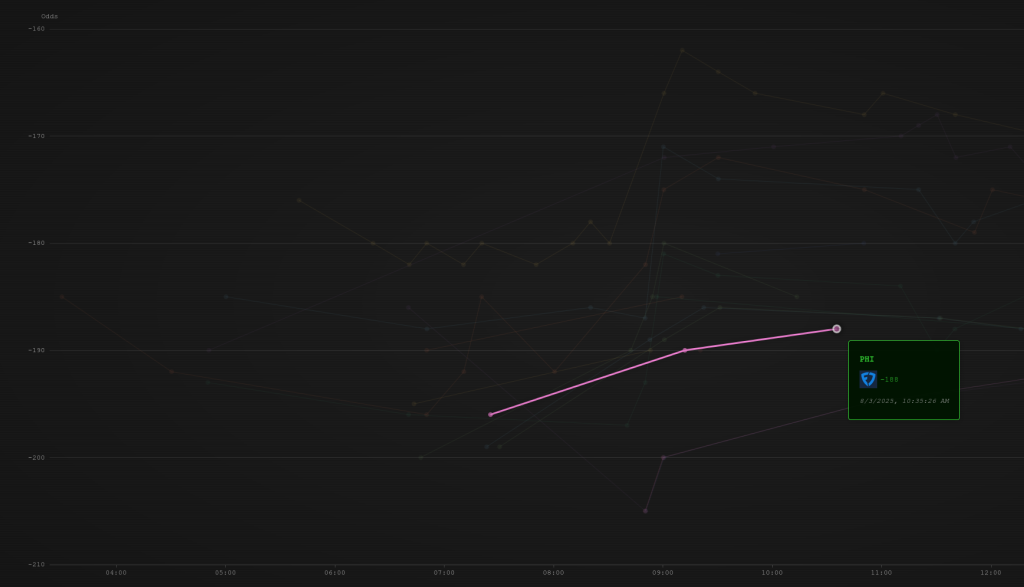
The sample sizes are kind of funky for this data (spread/runline may be wonky combination here), but it is the exact same methodology as for Pinnacle– the first found odds for an event compared to the last before the event’s start time. Notice that the odds vary significantly more– over 20% for NBA moneyline and over 34% for MLB moneyline. This just shows that the other books likely adjust lines much more aggressively pre-match. The below screenshot from Oddize’s Another Odds Board shows that FD isn’t always the best in terms of odds, which anecdotal, kind of matches what I’ve seen while working on another post.
Takeaways
So with all of this data, my key finding is that assumptions that I’ve held and read about in multiple books and dozens of online communities can and are wrong to take at face value. Digging into the data shows that books perceived as being sharp, may only be sharp due to second (or 10th) mover advantages. I’m working on incorporating this type of data (e.g. how sharp is a book) into future functionality on the Oddizer side of Oddize, so stay tuned for more programmatic examples of how to use a book’s odds against them.
Ideas or suggestions for future posts? Is this post egregiously incorrect? Maybe you want to send corgi pics? Opportunities to run a North Korean laptop firm? Email me directly at josh@oddize.com.